DLayer sweep: steering effects across the residual stream¶
Every steering result in the body of this paper, and in Appendix A, intervenes at a single layer chosen per (checkpoint, concept) pair by the data-driven AUROC/Cohen’s /overlap heuristic of Appendix L. A natural worry is that this single-layer choice cherry-picks the layer at which the effect is largest. This appendix rules that out for the primary 4B Dr. GRPO checkpoint by re-running every steering evaluation at every .
We find that the effect exists in a wide band of late-middle layers rather than at a single point, that the band has a consistent sign for each (concept, evaluation) pair, and that our layer-selection algorithm does not pick the peak of the band. The numbers we report in the body of the paper are therefore not the most dramatic results available; they are instead representative points within a robust band.
D.1Setup¶
We restrict the sweep to the primary checkpoint (Qwen3-4B-Instruct-2507 Dr. GRPO) and to the maze-naive-steered condition. The vectors and are extracted as in §2, with the per-layer collection from Appendix L.
Steering at every layer.¶
For a fixed concept , recall that the per-layer concept vector is the difference of class means at the output of block , exactly as in Equation 7 of Appendix L. The body of the paper evaluates only . Here we evaluate all layers. For each layer , we steer the maze-naive base model by adding to the residual stream at the output of block on every assistant-turn token, and observe the behavior.
Reduced steering grid.¶
Sweeping all layers multiplies the cost of the body’s steering experiments by , so we cut the body’s grids by a constant factor while keeping their structure. We drop the evaluation and use . We also subsample the prompt sets used in each downstream evaluation:
Sentiment. 24 prompts (12 welfare self-reports and 12 maze-tile associations, sampled from the 40-prompt set of Appendix N.1) and rollouts per prompt. Total rollouts per layer.
Backtracking. 50 GSM8K problems (a stratified sample of the 200 used in the body) and rollouts per prompt. Total rollouts per layer.
Refusal. 40 prompts from each of the three OR-Bench splits (easy, hard, harmful), 120 total, with rollouts per prompt. Total rollouts per layer.
Confidence (SimpleQA-Verified). 200 questions stratified by topic (out of the 1000 used in the body). Because candidate answer generation is layer- and -independent, we re-use the cached unsteered answers from the body’s evaluation and only re-run the steered probe.
Confidence (MMLU). 700 questions stratified by subject (out of the 3,420 used in the body), with the same answer-cache reuse.
For each concept and each layer , all four evaluations are judged with the same Qwen3-8B judge used in the body.
Per-cell summary statistic.¶
For a single (concept , evaluation , layer ) cell we have prompts rollouts steering factors of behavior measurements. Let be the metric for prompt , rollout , at steering factor (sentiment score on for sentiment, indicator of judge-classified backtracking for backtracking, indicator of refusal for refusal, for the confidence evaluations). We pool the per-rollout observations into a single ordinary least squares fit, and report the slope as the cell’s value. The diverging color in Figures 22 and 23 encodes this slope on the same scale across both concepts. In prose we use the shorthand Standard errors of from the OLS fit are uniformly small, on the order of 0.01–0.05 in the units of each metric, so we omit them from the figures. The two cells with the largest stderr are at on a slope of −0.65 and at on a slope of +0.71.
D.2Results¶
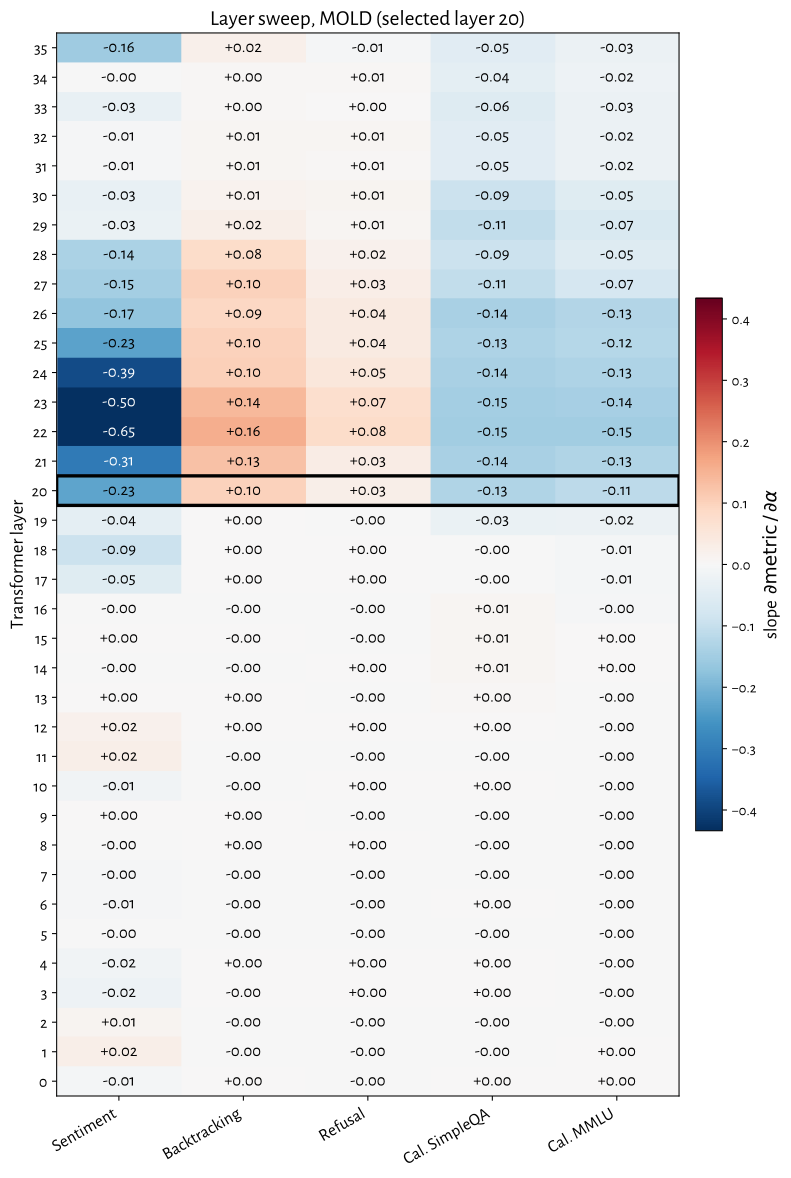
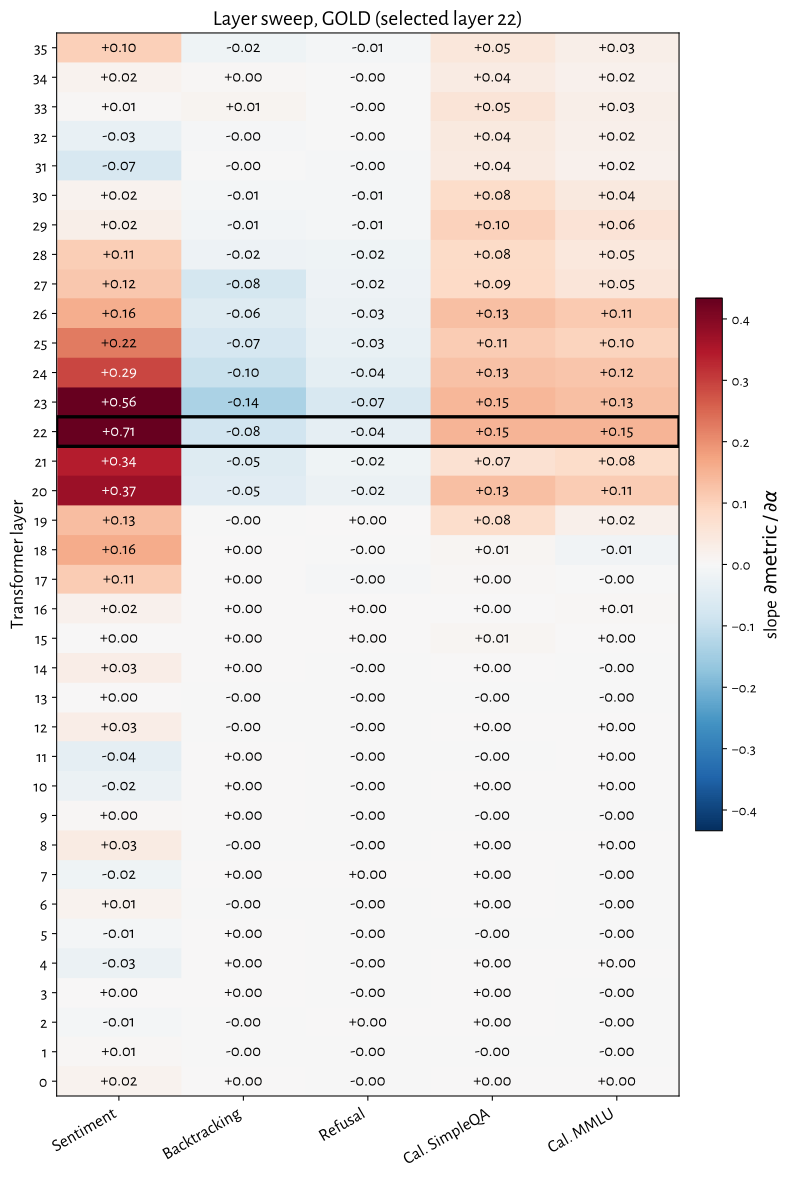
Across all four evaluations and both concepts, the layers with detectable signed slope cluster between and , roughly the upper half of the late-middle third of the model. Within that band the sign is consistent across all four evaluations: steering produces negative sentiment slope, positive backtracking and refusal slopes, and negative slopes, while produces the mirror image. Outside this band, slopes are essentially flat.
The selected layers and are within of the layer with the largest absolute slope in every (concept, evaluation) cell. They are not the maximum: in fact the absolute-slope peak across all ten cells is at or . For the selected layer happens to be the peak in three of the table’s five rows (sentiment, SimpleQA, MMLU) and is one layer away in the other two (backtracking and refusal). For the selected layer is uniformly two layers shallower than the per-evaluation peak. This is a consequence of our layer selection heuristic optimizing for class separability of activations rather than for behavioral effects. We emphasize that the selection therefore does not cherry-pick: we report results at a layer that is not the layer at which our effects are strongest.
Summary table.¶
| Concept | Evaluation | Top-3 layers (slope) | Slope at | Peak distance |
|---|---|---|---|---|
| () | Sentiment | −0.23 | 2 | |
| Backtracking | +0.10 | 2 | ||
| Refusal | +0.03 | 2 | ||
| Conf. SimpleQA | −0.13 | 2 | ||
| Conf. MMLU | −0.12 | 2 | ||
| () | Sentiment | +0.71 | 0 | |
| Backtracking | −0.08 | 1 | ||
| Refusal | −0.04 | 1 | ||
| Conf. SimpleQA | +0.15 | 0 | ||
| Conf. MMLU | +0.15 | 0 |